One dashboard. Smarter reporting.
The 3manager dashboard is your starting point for reporting. From here you can adapt the view to every role. Manage inventory, contracts, track costs and volumes, follow up on alerts, check supplies or report on environmental impact. Everything begins in one place, giving you the insights that matter most.
-
Anticipate problems before they escalate
-
Give every stakeholder the insights that matter
-
Make faster and more confident decisions
Discover how the dashboard works for you
Take a guided look at how the 3manager dashboard adapts to your needs and turns complex data into clear, actionable insights.
Choose from hundreds of data fields. Build the report you need.
Select exactly the information that matters to you. Use automated data collections or add manual data, then configure fields with just a few clicks.
The choice is yours.

Download or schedule in the format you prefer.
Get your reports instantly or schedule them daily, weekly, monthly, or at custom intervals.
Export in Excel, CSV, PDF, or XML. We also support JSON and partner-specific templates such as Evatic, Santi, Jim2, BMS, and SDF.
Reports can also be sent automatically by email, webhook, or (S)FTP.
Save reports as templates and cut repetitive work.
When managing large numbers of devices, repeating the same setup wastes time and increases the risk of errors.
With smart filters and templates, you only set up your report once. From then on, reuse it across clients with a single click and stay confident the data is always right.

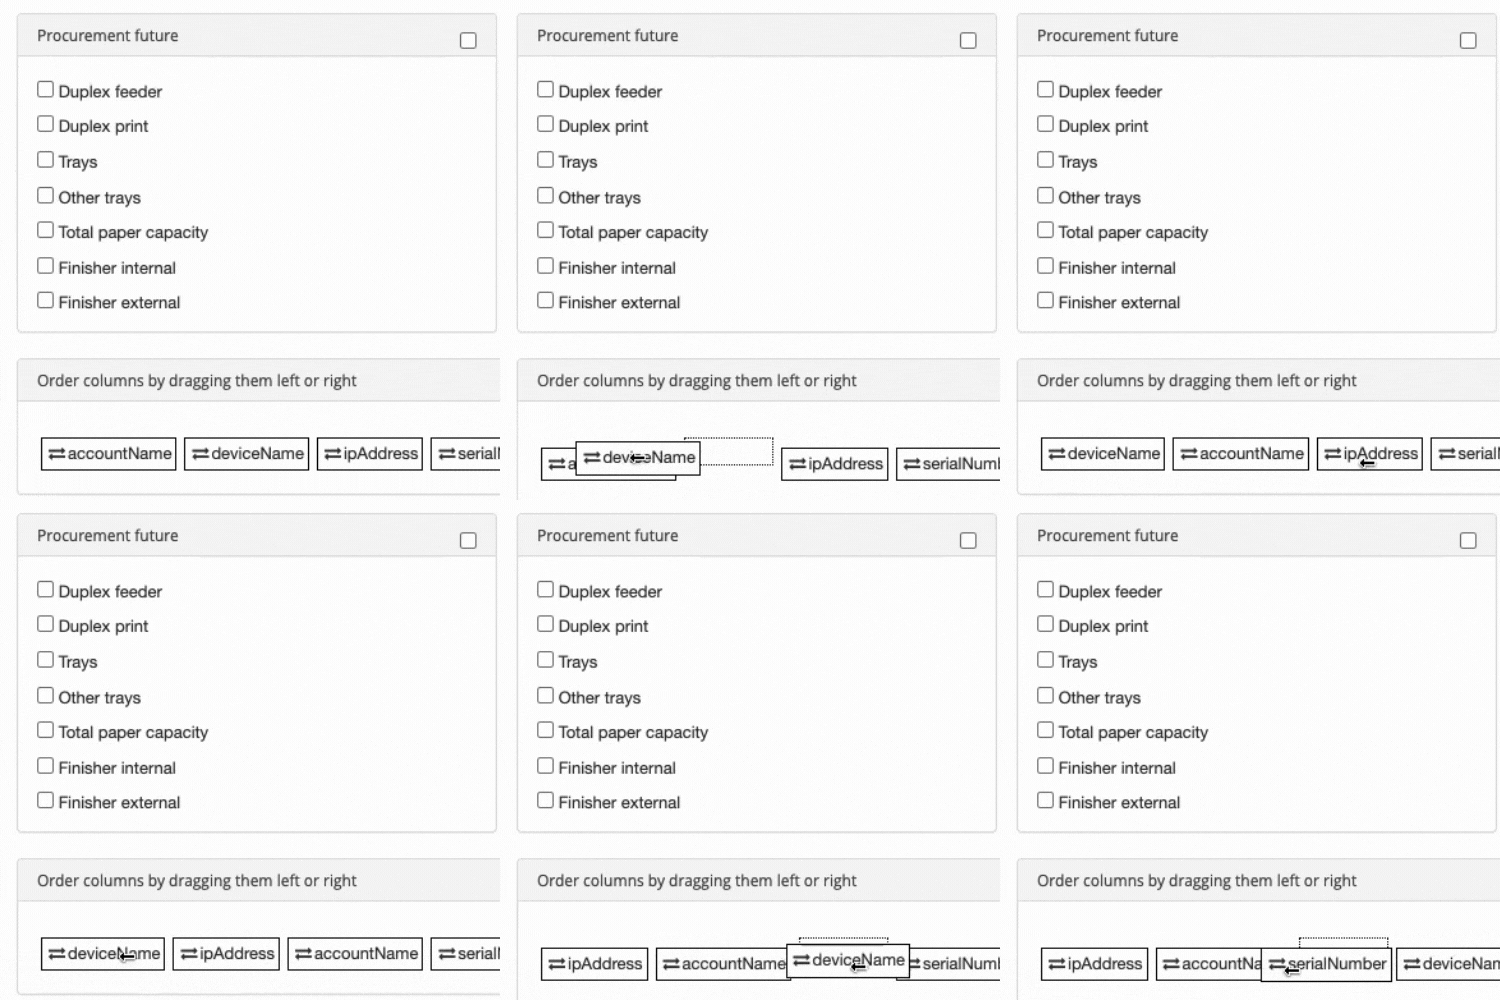
Arrange columns with simple drag and drop.
Need your data in a specific order? Just drag columns left or right and place them exactly where you want them. It’s quick, flexible, and keeps reports clear and easy to read.

Here are some examples of reports and templates you can build with The Equipment Report configurator
Meter reading reports for billing purposes
Choose between all available counters tracked. Schedule it as an automated report or show what a counter was at a specific time.
Volumes / pages printed
Do you need to know the pages printed last 30 days or maybe last calendar month, so you benefit from all days in the month for billing? Get the actual volumes or the average volumes printed every month. Choose between specific or pre-defined periods.
Devices with high toner waste
Easily pin out devices with a big toner waste problem, making it quick and easy to focus on the suitable devices to help reduce costs.
Over- or under-utilized printers
With data from thousands of devices, quickly access the ones utilized with more than 100% of the recommended volume per month, or 81% all depending on your needs. You control the filter.
Printer health/critical errors
Quickly identify printers with critical errors, including descriptions of errors, severity, alert age, and much more.
New business opportunities
What defines a business opportunity for you? High utilization? Contract end of life within three months, it's a color device, and volume is +15K per year? You define your definitions with the Equipment report.
New devices discovered
Get a daily report with new devices discovered by your clients, so it's easy to keep track of what's going on.
Planned replacements
You plan to replace the printers when it makes sense from a cost perspective, but when? If you add the information to 3manager, you can quickly get a report with planned dates for replacements.
Inventory lists
Quickly get an overview of all printers' locations with addresses, buildings, sites, floors, departments, and much more. Everything from one view
Audit reports
Get all the data needed per device with the many audit data options. For example, quickly understand current volume, utilization, recommended category, future need, costs, comments, and even which account manager made the audit.
Marketing campaign targeting
You want to run a marketing campaign to all clients with color printers with a high utilization because you can document savings. Not a problem. Add the query in 3manager, and you will get a list of clients and devices for your marketing campaign.
Green Information / CO2 emissions
Effortlessly generate a clear view of your devices' environmental impact. Visualize operational, standby, and sleep hours, along with estimated kWh usage and CO2 emissions, for a comprehensive eco-footprint assessment
... and much more.

To sum it up...
Who can use this report? Anyone who has an interest in using data to make good decisions.
Why spend hours on analyzing data, when you can get it quickly, processed, and ready?
Whether you are in sales, tech, management, the Equipment report will make your life easier when it comes to printer data management.
The Equipment report will deliver your needed reports instantly with a flexibility never seen before.
Easily create any report from meter reading reports to forecasting reports.
When you first start mastering the Equipment report you will quickly incorporate it into your daily routines, whether it's for quick insights to status meetings or to ongoing customer reporting.
